Gantt Charts: The Complete Guide for 2025
In a professional landscape where up to 70% of projects fail to meet their original goals, effective planning and tracking are no longer optional—they are the pillars of success. The Gantt chart, a visual project management tool invented over a century ago, remains surprisingly relevant and powerful in 2025. Recent studies show that organizations using formal project management methodologies, with the Gantt chart as a central component, are 2.5 times more likely to succeed. This tool does more than just list tasks; it transforms a complex plan into a clear, understandable timeline, illustrating dependencies, resource allocation, and the critical path. The trends for 2025 are seeing the deep integration of AI and automation into Gantt chart software, making real-time tracking and predictive adjustments more accessible than ever. This comprehensive guide will not only explain how to create a Gantt chart but also how to use it as a dynamic instrument to steer your projects toward success.
Why Gantt Charts Are Indispensable in 2025
Far from being a simple graph, a Gantt chart is a strategic dashboard. It provides unparalleled clarity that addresses the key challenges of modern project management: complexity, collaboration, and communication.
Immediate Visual Clarity
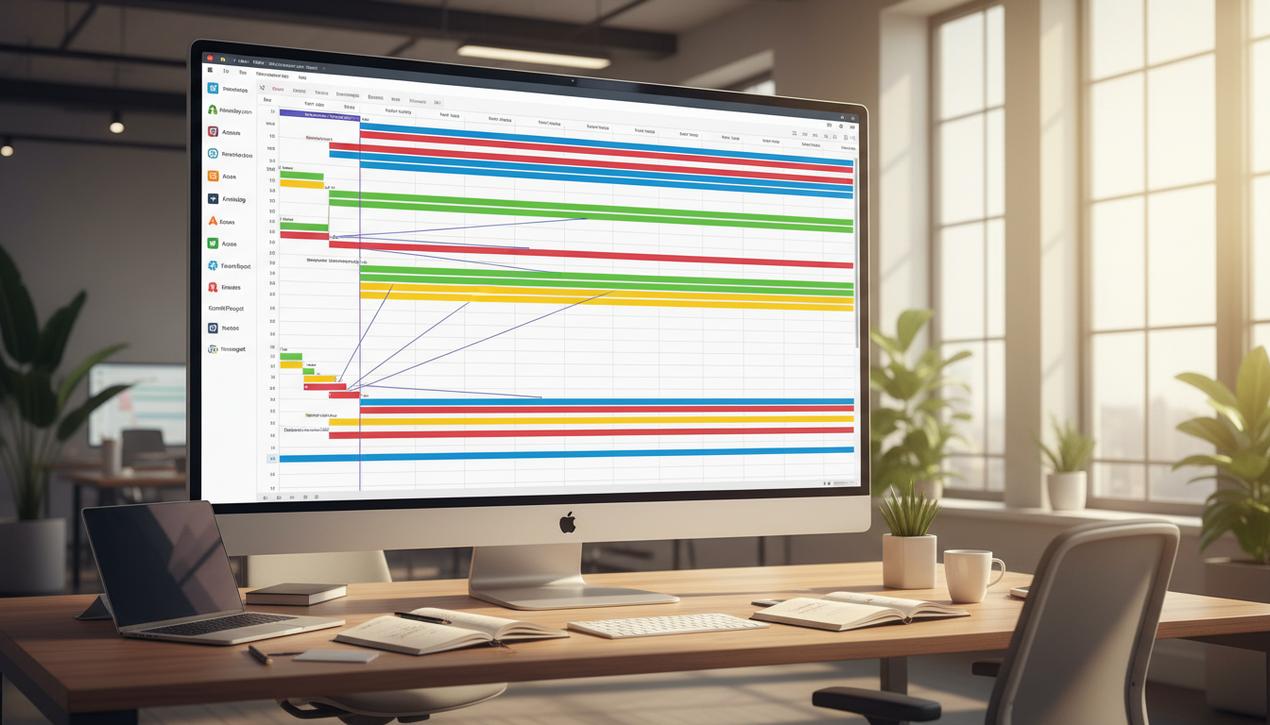
The primary strength of the Gantt chart is its ability to visualize an entire project at a glance. It presents a clear timeline where each task is represented by a bar whose length corresponds to its duration. This allows stakeholders to instantly understand:
- What tasks need to be completed?
- When should each task begin and end?
- How long will each task take?
- How do tasks overlap and interact?
- What is the project’s scheduled completion date?
Enhanced Communication and Collaboration
A Gantt chart serves as a single source of truth for all project stakeholders. It aligns teams, management, and even clients on the same schedule and expectations. Modern software, often complemented by other effective collaborative tools, allows for shared access and real-time updates, ensuring everyone is working with the most current information. This drastically reduces misunderstandings and improves coordination across departments.
Optimized Resource Management
A well-designed Gantt chart allows for the assignment of resources—both human and material—to each task. This visualization helps project managers identify potential bottlenecks or periods where a resource might be over-allocated. In 2025, where cost and efficiency optimization are paramount, this feature is crucial for preventing waste and ensuring the right people and tools are available at the right time.
Creating an Effective Gantt Chart in 7 Steps
Building a Gantt chart involves more than just drawing bars on a calendar. It requires rigorous upfront planning. Follow these steps to construct a robust and reliable project management tool.
1. Define the Project Scope and Objectives
Before anything else, clarify what you aim to achieve. Use the SMART (Specific, Measurable, Achievable, Relevant, Time-bound) criteria to set your objectives. What is the start date and the desired end date? What are the final deliverables? Without a clear vision, your schedule will lack direction.
2. List All Tasks and Sub-tasks
Break down the project into smaller, manageable tasks. This process is formally known as creating a Work Breakdown Structure (WBS). Be as exhaustive as possible. For a “website launch” project, for example, major tasks might include “Design,” “Development,” “Content,” and “Marketing,” each broken down into specific sub-tasks like “Create wireframes” using some essential wireframe tools, “Code homepage,” and “Write blog posts.”
3. Estimate the Duration of Each Task
For each task identified, estimate the time required for its completion (in hours, days, or weeks). Be realistic. Rely on data from past projects or consult with the team members who will be performing the work. It’s often wise to add a small buffer for unforeseen issues.
4. Identify Dependencies Between Tasks
This is one of the most critical steps. Tasks are rarely independent. A dependency means that one task cannot begin or end until another task has begun or ended. We will detail the four types of dependencies below.
5. Define Project Milestones
Milestones are key checkpoints in your project. They have no duration but mark the end of a significant phase (e.g., “Design Approved,” “Website Live,” “Marketing Campaign Launched”). They are essential for tracking progress and celebrating intermediate achievements.
6. Assign Resources
Allocate each task to a specific person or team. Also, list the material resources needed (e.g., software, equipment). This step ensures you have the necessary capacity and holds each team member accountable for their part.
7. Choose the Right Tool and Build the Chart
Once you have your plan on paper, it’s time to digitize it. Input all your data—tasks, durations, dependencies, resources—into a project management software. The tool will then automatically generate the visual Gantt chart for you.
Mastering the 4 Types of Task Dependencies
Understanding the relationships between tasks is the key to a realistic schedule. There are four types of dependencies you need to know:
- Finish-to-Start (FS): This is the most common dependency (used in over 95% of tasks). Task B cannot begin until Task A is complete. Example: You cannot paint the walls (B) until the drywall is installed (A).
- Start-to-Start (SS): Task B cannot begin until Task A has begun. They can then run in parallel. Example: Writing the website’s content (B) can begin at the same time as the website’s development (A).
- Finish-to-Finish (FF): Task B cannot be completed until Task A is completed. Example: The final QA testing of a website (B) cannot finish until all bug fixes (A) are completed.
- Start-to-Finish (SF): This is the rarest and most complex type. Task B cannot be completed until Task A has begun. Example: The support team for a legacy system (A) must start their shift before the team decommissioning that system (B) can finish their work.
Steering and Adjusting Your Project with a Gantt Chart
A Gantt chart is not a static document to be created and then forgotten. It is a dynamic tool for steering your project. Review it regularly (at least weekly) to track progress and make necessary adjustments.
Is the project on schedule? Visualizing the critical path—the sequence of tasks that determines the project’s total duration—tells you immediately if a delay in a key task will impact the final delivery date. Modern software often highlights this path for you.
How should you handle delays? If a task falls behind schedule, you must take action. Can you reallocate resources to speed up the work? Can the delay be absorbed by the slack in a subsequent task? Do you need to renegotiate the final deadline? The Gantt chart helps you make these decisions based on data, not guesswork.
Can the schedule be optimized? Re-evaluate dependencies. Can some “Finish-to-Start” links be changed to “Start-to-Start” to allow tasks to overlap and save time? By optimizing these links, you can potentially shorten the overall project duration.
Top 7 Tools for Creating Gantt Charts in 2025
Gone are the days of drawing charts by hand or struggling with spreadsheets. Modern applications make Gantt chart creation intuitive and collaborative.
- Monday.com: Highly visual and customizable, it integrates the Gantt chart as one of its many project views. Ideal for teams that value a colorful and user-friendly interface.
- ClickUp: An all-in-one platform that offers a powerful Gantt view. Its strength lies in its flexibility and rich feature set, scaling from individual freelancers to large enterprises.
- Asana: Known for its simplicity, Asana has a “Timeline” view that functions as a Gantt chart. It is perfect for teams that need to quickly visualize their workflows.
- TeamGantt: A specialized tool dedicated entirely to Gantt charts. It is renowned for its ease of use and clean design. Ideal for those who want a straightforward and powerful tool.
- Microsoft Project: The legacy tool and one of the most comprehensive on the market. It is extremely powerful for managing highly complex projects but can have a steep learning curve.
- GanttProject: A free and open-source option. While less polished than its paid competitors, it remains a robust and functional solution for those on a tight budget.
- Instagantt: A tool that integrates seamlessly with Asana, offering more advanced Gantt chart features than Asana’s native function, especially for resource management.
The Gantt chart is much more than a simple timeline of tasks. It is a universal language for project management, a powerful communication tool, and an indispensable ally for navigating complexity. By following a structured methodology to create it and using it as an active steering tool, you transform a simple schedule into a true performance lever, drastically increasing the chances of delivering your projects on time and within budget.

Boost your social media engagement by turning text into stunning images. We review the 9 best visual quote tools, from Lire la suite

Choosing the right Java frameworks is crucial for modern development. This guide analyzes the 8 best options for 2025, from Lire la suite

AI content generation tools often fail with long articles. Understand their limitations and learn how a structured, section-by-section approach can Lire la suite

Effortlessly combine documents. Our guide details the 12 best free tools to merge PDFs safely and quickly, helping you streamline Lire la suite